Using MeterWatch.
What each number on your screen means, and which numbers the sensor measured and which MeterWatch calculated. You see these in the website and the Android app.
Measured and calculated values
The sensor measures one thing: how much electricity your meter has counted. Everything else on the screen is worked out from that measurement.
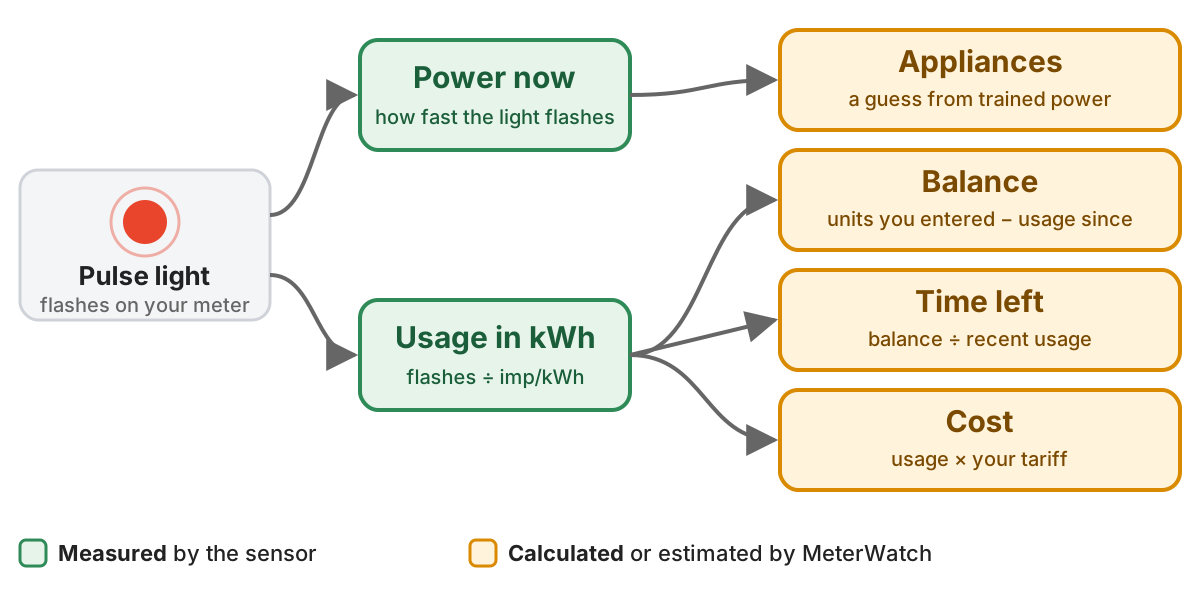
Green values come from the sensor. Amber values are worked out from them.
| Power now Measured | How fast you're using electricity right now, from how quickly the pulse light is flashing. |
|---|---|
| Usage in kWh Measured | Flashes counted, divided by your meter's imp/kWh rating. |
| Balance Calculated | The units you last entered, minus the usage measured since. The sensor can't read the balance from your meter. |
| Time left Estimated | Your balance divided by your recent usage. It changes when your usage changes. |
| Cost Calculated | Your usage priced with the tariff. "Per day at current use" assumes you keep using power at today's rate all day. |
| Appliances Estimated | A guess at which trained appliances are on, based on the power they drew when you trained them. |
The Live view
Open a meter's Live view to see what's happening now.
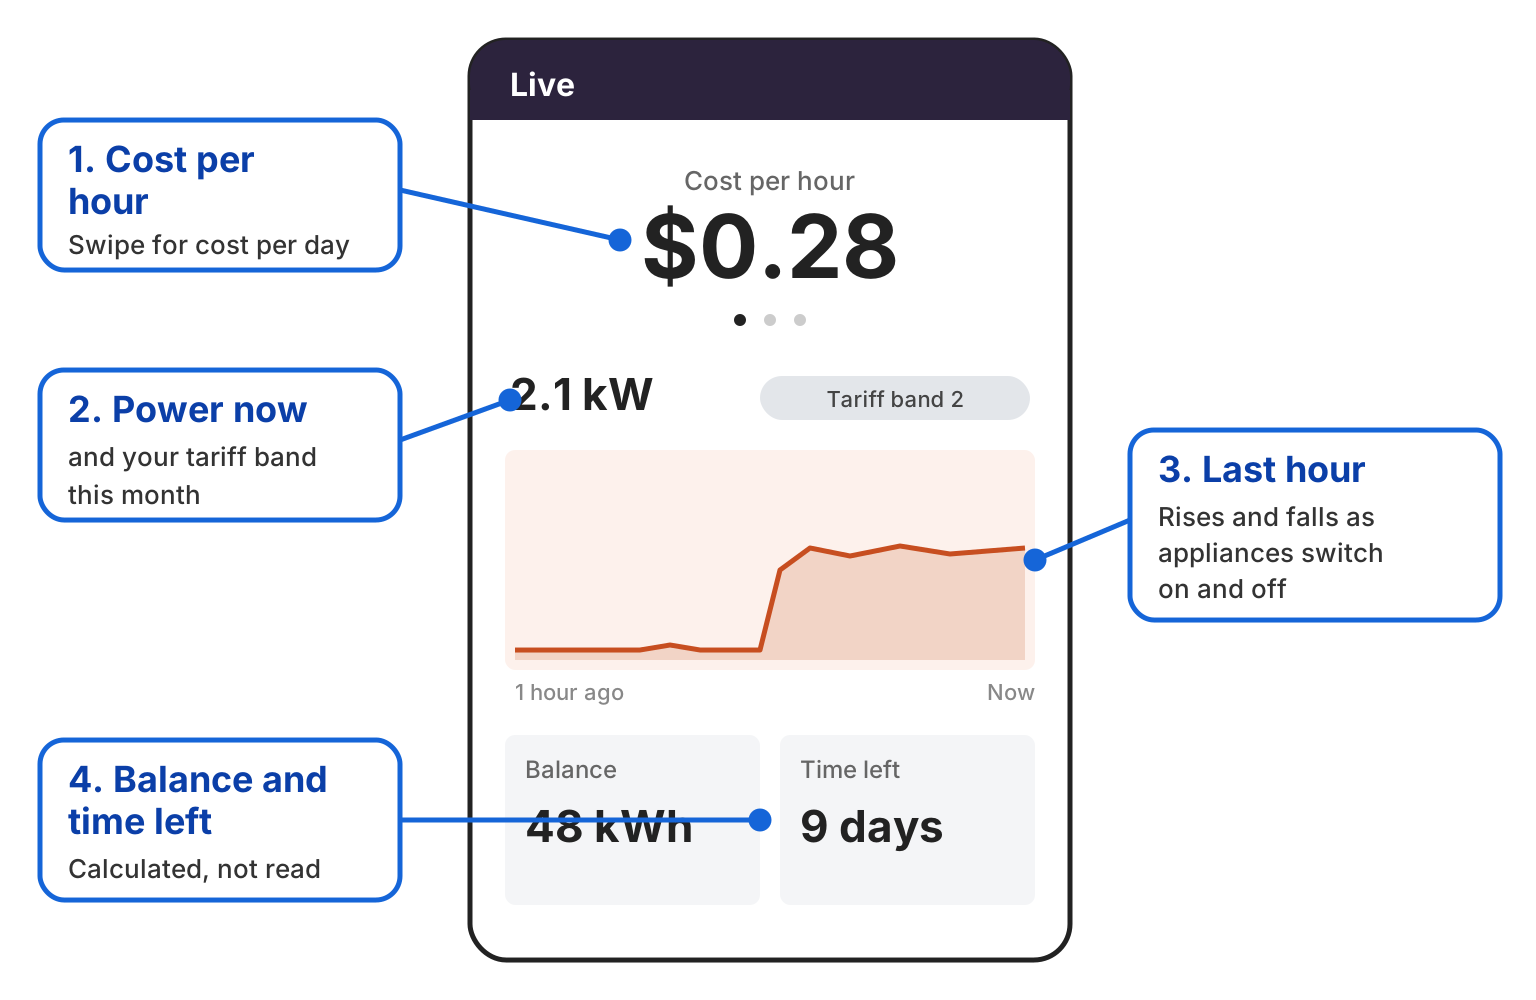
The Live view, with the four parts you use most.
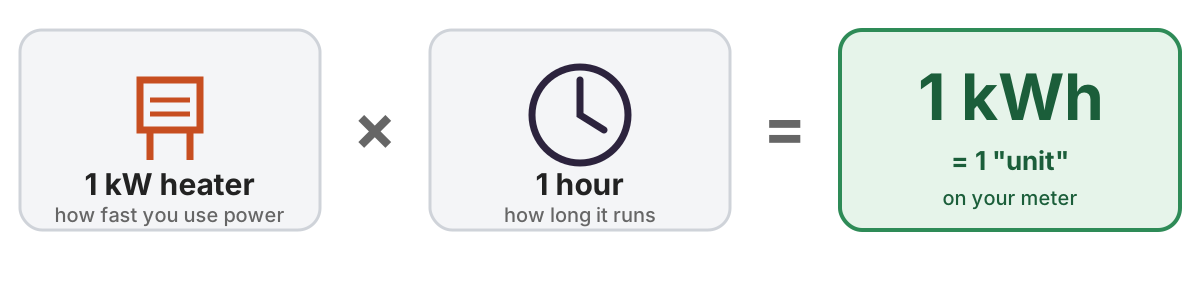
Kilowatts (kW) and kilowatt-hours (kWh) are different. A kilowatt shows how fast you use power. A kilowatt-hour shows how much you've used.
Status messages
- No signal
The sensor hasn't reported recently. The screen shows the last reading time, and balance and time left show your last known values. See troubleshooting.
- Power is off
The sensor has reported that your mains power is off.
- No live sensor
No sensor is linked to this meter. Link one on the Meters page.
- Estimated
The value comes from your top-ups, not a sensor, or the sensor isn't reporting.
Usage history
Open History for a meter and choose a time range. Each bar shows the kWh used in that period. Tap a bar for its details.
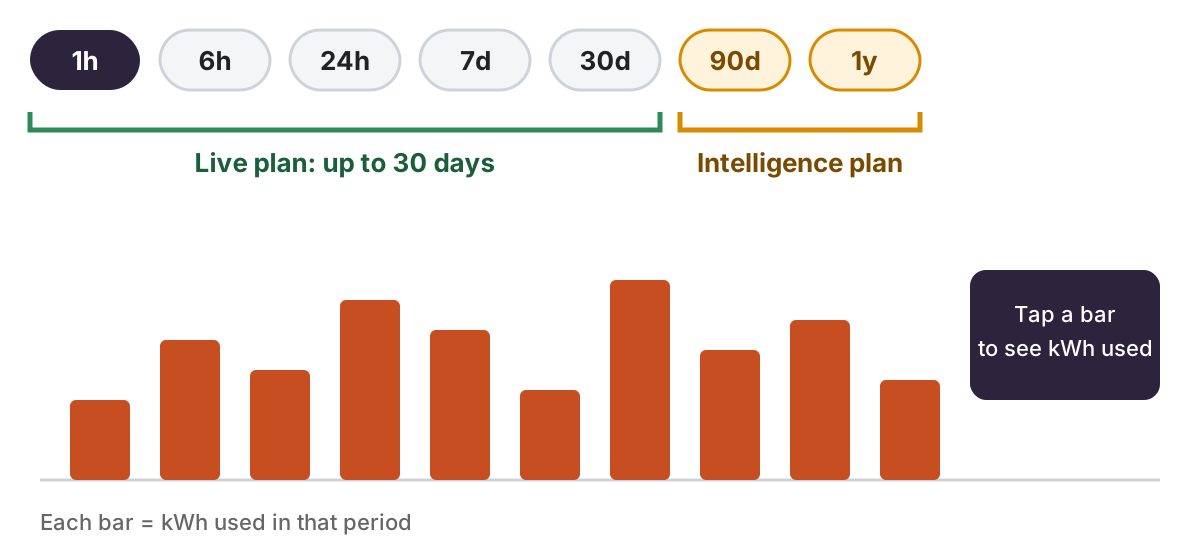
Time ranges. 1h to 30d are on the Live plan. 90d and 1y need the Intelligence plan, which keeps everything since the sensor was installed.
If your plan ends, the sensor keeps recording. Your history is there again when you pay.
Longer ranges group readings into larger blocks, such as days or weeks, so bars are bigger and less detailed.
How often values update
The sensor sends readings to MeterWatch over Wi-Fi, and the app shows the latest it has received. If readings arrive slowly, the Live view shows your current power from the most recent ones and when they arrived.
Monthly totals and cost
The Data page shows your monthly kWh, your tariff band and an estimated cost. The cost is an estimate, so it can differ from the amount on your actual bill.
- Monthly kWh
How much you used this month.
- Tariff band
The band your usage puts you in.
- Estimated cost
Your usage priced with the tariff.
When things change
- Changed Wi-Fi
Your sensor was set up with your Wi-Fi before delivery, so contact us with your sensor ID. You don't need to link it again.
- Moved the sensor head
Check it's centred on the pulse light. Follow step 2 of the setup guide.
Replaced your meter
- Remove the tape
Peel the sensor head off the old meter and wipe off any residue with a damp cloth.
- Fit the new meter
Attach it as in step 2.
- Add and verify
The new meter must be added and verified first.
- Unlink, then link
In Meters, unlink the sensor from the old meter and link it to the new one.
Transferred the sensor to someone else
- You unlink
In Meters, unlink the sensor from your meter.
- They link
The new owner links it to their own meter in Meters, using the sensor ID.
Need help?
Read the FAQ, or contact us with your sensor ID.